Diagnosing problems and errors in a live website is usually a difficult task, particularly if the installation is on-premises. Application Insights running in Microsoft Azure however, makes things a lot easier. This article deals with diagnosing failed requests.
Failed requests can sometimes be caused by an error, and other times it will simply be a resource that wasn't found. If it is an error the response code from the web server will usually be 500, and for resources that aren't found it will usually be 404.
Depending on the logging that you have set up you may be aware of all failed requests, but often even errors can stay hidden below the surface. So much so that even your users may not even be aware of them.
All failed requests need to be fixed as they are using resources unnecessarily. Application Insights makes it very easy to spot and diagnose them.
The best way to see them in Application Insights, running in Microsoft Azure is the Failures tab. To find this, go into the Azure Portal, then go to your Application Insights instance. Next click on the Failures Tab in the Investigate section, which is halfway down the left hand menu.
You will see something like this:
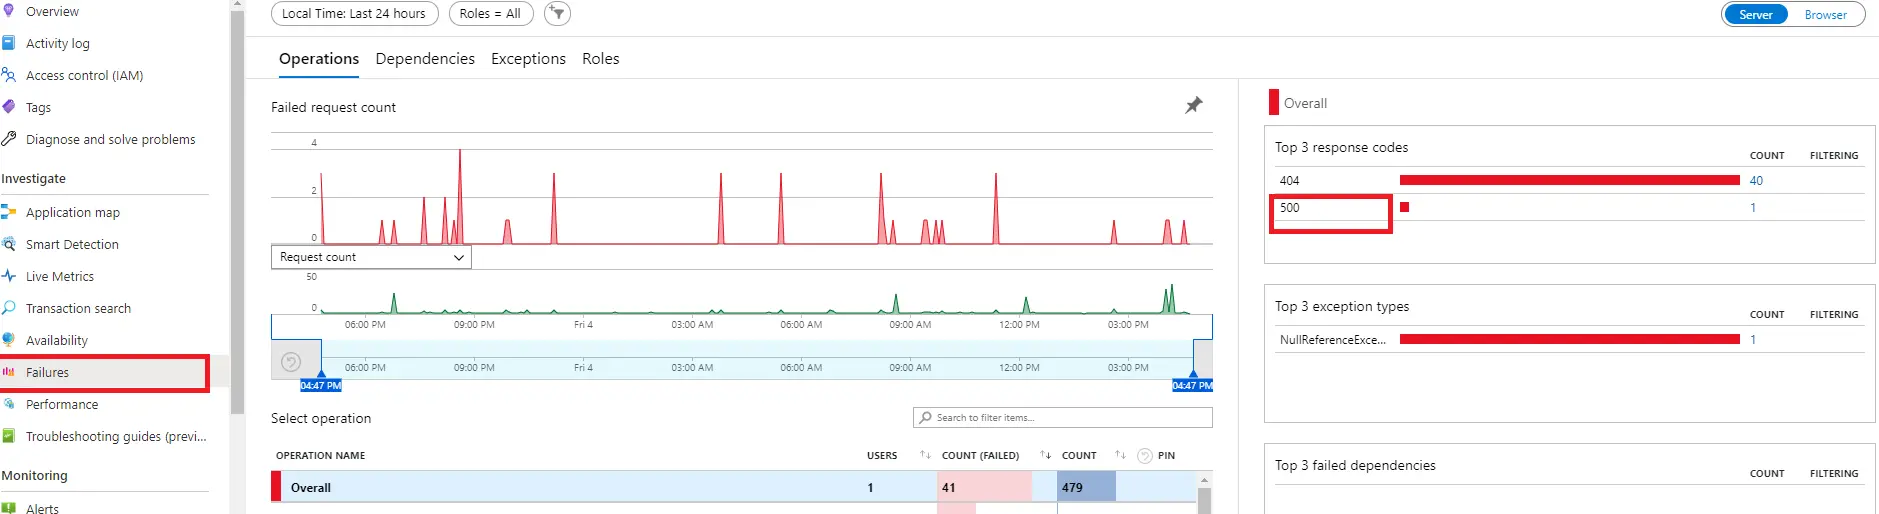
On the top right is a summary of the top response codes and the number of occurences of each type. In this case there is a 500 response code . A 500 code means an error so you would almost always want to fix that first.
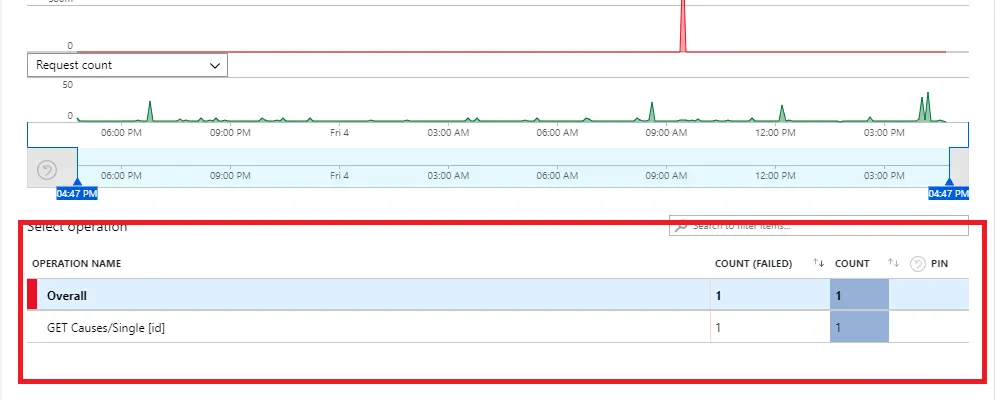
When you hover over each row two filter icons appear in the Filtering column, giving you the option to add or remove a filter on that response code. You can then click on the + Filter icon which then refreshes the report, having filtered on just this response code. In my case after I click on the + Filter icon for the 500 response the screen changes and in the Operation Names list is just one entry which is the name of the Operation which caused the error:
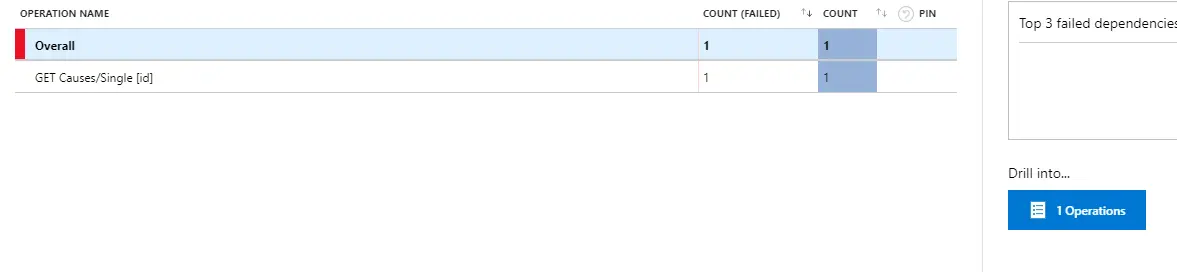
When I click on that Operation another icon appears at the bottom right which gives me the option to Drill into the Operation causing the error.
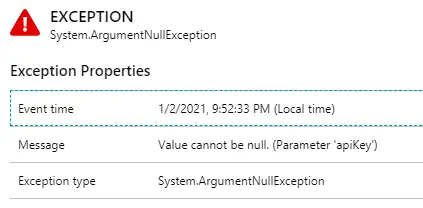
When I click on the Blue icon to drill into that operation some further detail about the Operation(s) appears on the right of the screen. I can then click on the "Suggested" box and that takes me all the way into the End to End Transaction details tab. This gives me all the information I need to diagnose the error, including the Call Stack.
All the best